July 27, 2024, 3:04 a.m.
XAG/USD [SILVER] Market Outlook
Sept. 5, 2023
11
2213
0

Author
Luhan OosthuizenAnalysing SILVER with in-depth analysis + key levels to look out for.
Silver is currently facing significant downward pressure, having declined for five consecutive days. It recently fell to a two-week low around $23.65 after being rejected at the $25.00 psychological mark.
From a technical standpoint:- Breaking below the $23.80-$23.75 range, marked by the 200-period Simple Moving Average (SMA) on the 4-hour chart, could trigger more bearish sentiment.
- Daily oscillators are turning negative, suggesting a potential near-term downtrend.- However, the hourly Relative Strength Index (RSI) indicates oversold conditions, hinting at a possible consolidation phase near current levels, which is the 50% Fibonacci retracement level of the $22.25-$25.00 rally.
If the bearish momentum continues:
- Silver might test the 61.8% Fibonacci level around $23.30-$23.25, potentially extending to the $23.00 mark.- Further downside could target a strong horizontal support zone near $22.20-$22.10.
On the flip side:
- The $23.75-$23.80 region, where the 200-period SMA resides, acts as immediate resistance.- Breaking above this level could open the door to the $24.00 round-figure mark, representing the 38.2% Fibonacci level.
- Beyond that, a short-covering rally might push the XAG/USD toward the 23.6% Fibonacci level at $24.30-$24.35.- A sustained breakthrough above $25.00 could favor bullish traders.
In summary, silver is currently under bearish pressure, but oversold conditions on the hourly chart suggest a potential consolidation. Key levels to watch are the $23.80-$23.75 support and the $24.00 resistance.
Related Tags:
Related Articles
All articles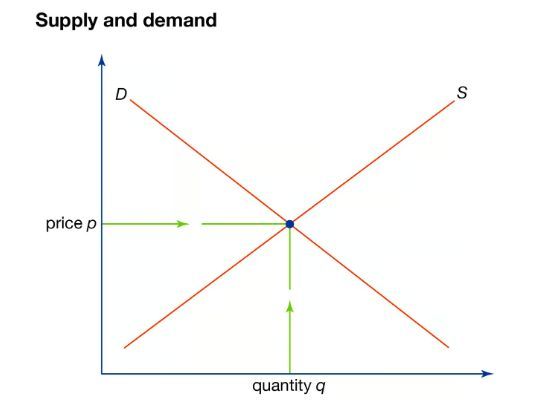
July 27, 2024, 6:24 a.m.
Why do prices go up and down?

July 27, 2024, 5:36 a.m.
UNDERSTANDING INVESTMENT HOLDING COMPANIES
July 26, 2024, 12:05 p.m.
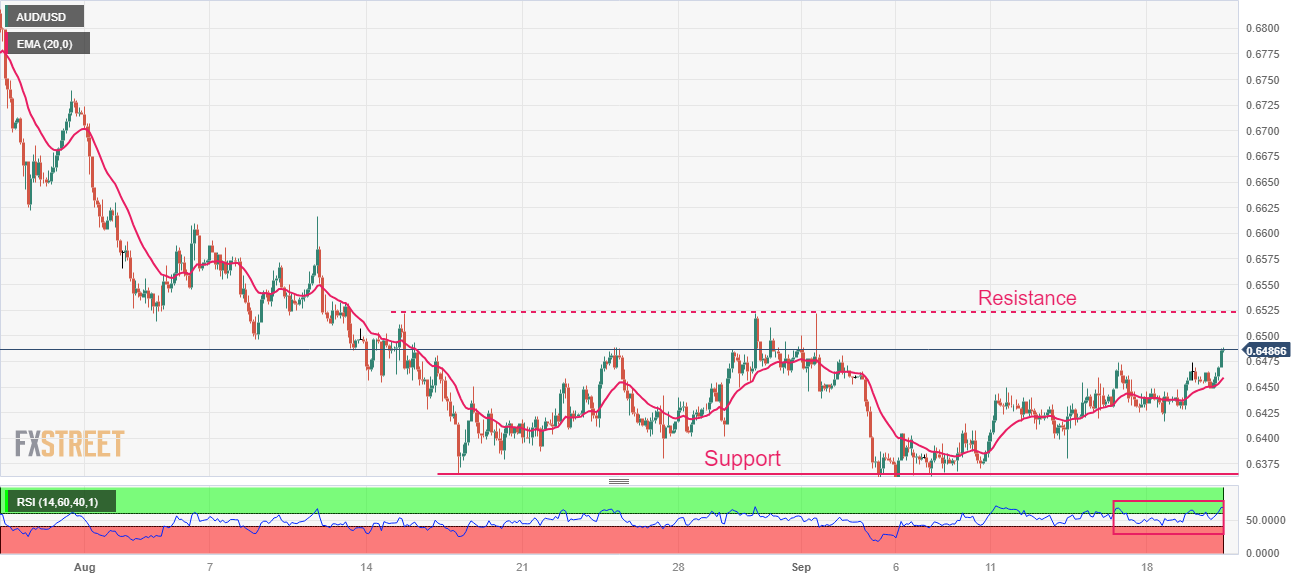
AUD/USD Market Outlook

July 26, 2024, 8:53 p.m.