July 27, 2024, 3:04 a.m.
WHAT IS SWING TRADING?
July 17, 2023
15
1963
0

Author
Soul FinancialBuy the rumour, sell the news
Often investors use the words investing and trading interchangeably, but there is a distinct difference. Investing is taking calculated risks according to your risk profile. Trading is buying and selling stocks to capitalise on daily price fluctuations. The differences lie in the time horizon and the amount of risk you are taking on.
When you invest you are buying a piece of a business. You are an owner. If you own a business, you focus on the business. Things like Competitors, Revenue, Profits, Assets, Debt are what you focus on. You do not own a business and daily think about the value of the business and what someone is willing to pay you to buy your business. When youre buying shares of a business, stock price is important. Once you own those shares, you own a piece of the business, and unless youre planning to sell, the stock price is irrelevant.
Trading is very different to investing. When you trade, you need to focus on price action. You own shares for a short period. When the price hits a certain level, traders buy or sell their shares.
Day Trading
As the name suggests, day trading is when you buy and sell stocks every day based on technical charts alone. You do not consider the fundamentals or the value of the company. Day traders study technical charts and "bet" on the odds. I would never call day trading gambling because it requires immense skill and hard work. Unlike going to a casino and betting on either red or black, day traders use charts to analyse what a share price will do based on historical price movements.
Day trading is high risk. You can lose your capital and I do not recommend day trading for novice investors or investors who are not comfortable reading technical charts.
Swing Trading
Swing traders in essence work off the premise that the market overreacts and always goes back to normal. They take advantage of that fact. The share price and the perceived value of the company do not match at a specific time.
Becoming a profitable swing trader takes time, effort, and a commitment to learning and improving. Here are some tips that may help:
- Before you start trading, you should have a well-defined trading plan that includes your entry and exit strategies, risk management techniques, and trading goals. Your plan should be based on a thorough analysis of the market, and it should be flexible enough to adapt to changing market conditions.
- Technical analysis involves using charts and indicators to identify market trends, support and resistance levels, and other patterns that can help you make informed trading decisions. You should develop a solid understanding of technical analysis and use it to inform your trading strategies.
- Risk management is crucial to successful swing trading. You should never risk more than you can afford to lose, and you should always use stop-loss orders to limit your losses. You should also diversify your portfolio to reduce your overall risk.
- Keeping a trading journal can help you track your progress, identify your strengths and weaknesses, and adjust your trading strategies. Your journal should include details of each trade, including the entry and exit points, the reasoning behind your decision, and the outcome of the trade.
- The markets are constantly evolving, and it's important to stay up-to-date with the latest trends and developments. You should continue learning and improving your trading strategies and seek out the advice of other successful traders.
Personal Swing Trading Strategy
I focus on three areas when I swing trade:
- Fundamentals of the business
- Relative Strength Index also known as the
- RSI Exponential Moving Averages also known as EMAs
Fundamentals of the business
Unlike day trading, I need to understand the instrument I am investing into. It is very important to understand what is driving the share price of the business significantly up or down when swing trading. If you do now understand the fundamentals, you might be catching a falling knife.
Relative Strength Index
The RSI is a popular technical analysis indicator used by traders to measure the speed and change of price movements of an asset. It is a momentum oscillator that compares the magnitude of recent gains and losses over a specified period of time to determine whether an asset is overbought or oversold. The RSI is typically displayed as a line graph that ranges from 0 to 100.
The RSI is often used to identify potential overbought and oversold conditions in the market. When the RSI value is above 70, it suggests that the asset is overbought and may be due for a price correction or reversal. Conversely, when the RSI value is below 30, it indicates that the asset is oversold and may be poised for a price rebound.
When I enter a swing trade, I stretch these variables to 80 for overbought and 20 for oversold. I thus do not buy until the RSI is below 20 or I do not sell until the RSI is above 80.
In the context of financial markets, oversold refers to a situation where the price of an asset has experienced a significant and prolonged decline, leading to a point where it is considered to be undervalued or trading at a price lower than its intrinsic value. It implies that the selling pressure on the asset has been excessive, pushing its price down to levels that may be below what is justified by its fundamentals or historical trading patterns.
When an asset is considered overbought, it implies that there may be selling opportunities in the market. Traders and investors often look for overbought conditions as potential signals for a price reversal or a corrective pullback in the asset's value. The assumption is that the buying pressure has reached an extreme, and there may be a higher probability of a price decrease in the near future.
Exponential Moving Averages
EMA is a commonly used technical analysis indicator that calculates the average price of an asset over a specified period, giving more weight to recent price data compared to older data points. It is a type of moving average that aims to respond more quickly to changes in price trends. While a simple moving average (SMA) calculates the average price by equally weighting all data points within the chosen period, the EMA assigns more significance to the most recent prices.
I use a very simple strategy. I only buy if the current 50-day EMA and 200-day EMA are 30% above the ruling price. I only sell if the current 50-day EMA and 200-day EMA are 30% below the ruling price. Rationale being, that the EMA is the memory price and price always wants to return to its memory price. Leave lots of room in case you are wrong.
It's important to note that technical indicators are not infallible and should be used in conjunction with your knowledge of the business.
Disclaimer: Nothing in this article should be seen as financial advice. Everything stated is for educational purposes only. Always do your own due diligence. Trading involves high levels of risk.
Related Tags:
Related Articles
All articles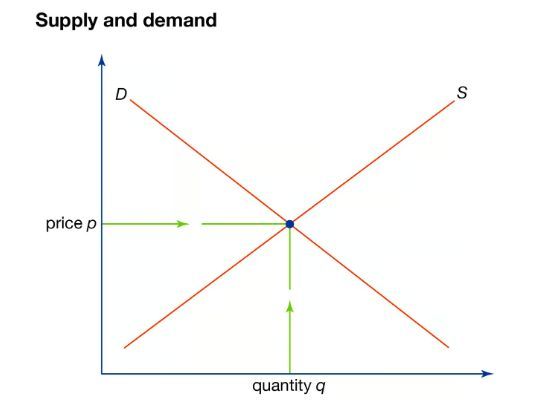
July 27, 2024, 6:24 a.m.
Why do prices go up and down?
July 27, 2024, 5:36 a.m.
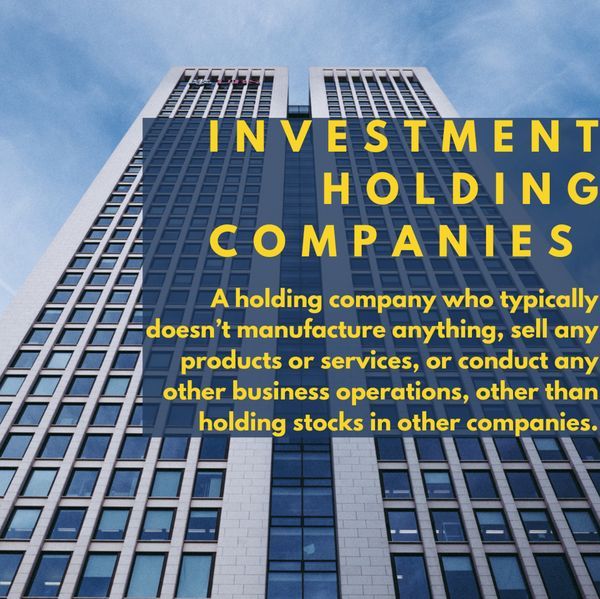
UNDERSTANDING INVESTMENT HOLDING COMPANIES
July 26, 2024, 12:05 p.m.
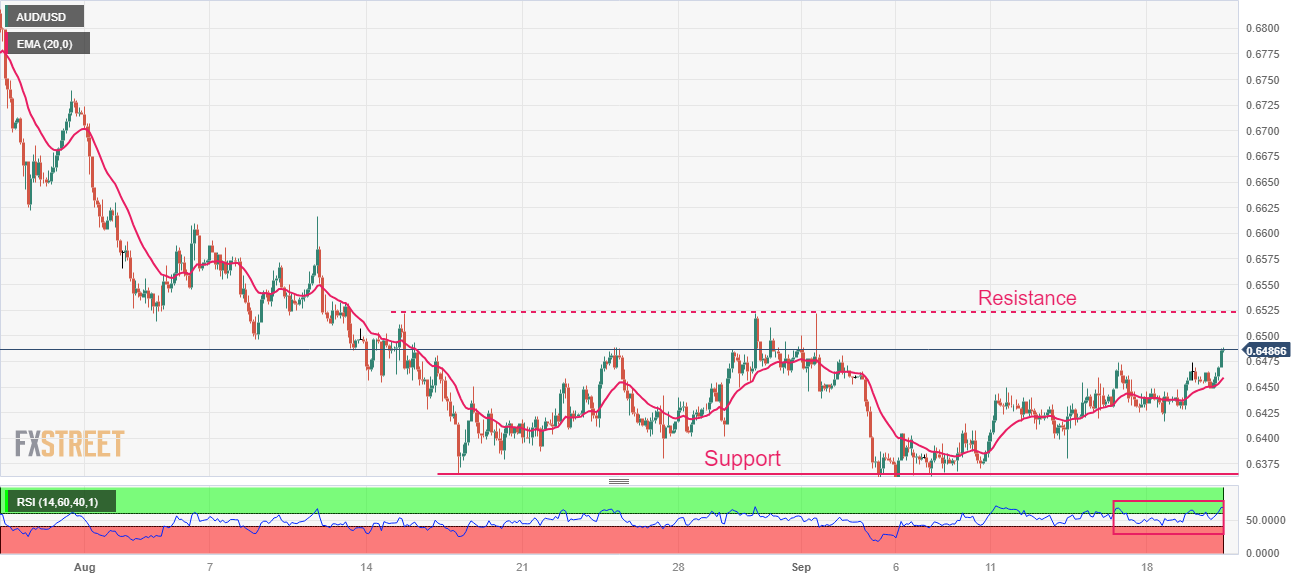
AUD/USD Market Outlook

July 26, 2024, 8:53 p.m.