July 27, 2024, 3:04 a.m.
What are you trying to tell us, Bitcoin?
July 17, 2023
17
67
0

Author
FinMeUpInvestigating five NB on-chain metrics
The prices of cryptos have been dropping aggressively. Bitcoin, the most stable of all the cryptos, has fallen from $69 000 in Nov 2021 all the way down to $19 500 at the time of writing. In times of uncertainty, panic often sets in, and the dominoes start to fall.
We are currently experiencing a major retraction across all asset classes as the fed tightens its monetary policy amidst inflation fears and global economic uncertainty. In times of crisis, it is essential to stay calm and level-headed.
The best strategy in this market is to re-evaluate ones investment thesis. Is Bitcoin as an open-source, decentralized, digital currency with a programmed monetary policy and a finite supply STILL relevant and valuable, or has value somehow deteriorated with price?
Price deviates from value all the time. The trick is to find assets that are worth more than what the market estimates them to be. This article investigates some of the most important underlying Bitcoin metrics to determine to which degree its fundamentals are correlated with the current downward price action.
Total hash rate
Total Hash Rate (TH/s) is a key security metric which represents the number of terahashes per second the bitcoin network is performing in the last 24 hours. The more hashing (computing) power in the network, the greater its security and its overall resistance to attack. Figure 1 illustrates that bitcoin is more secure today than it has ever been before. The only notable slump in hash rate was when China banned mining back in mid-2021. Miners migrated and the network recovered within only a few months.
Fees per transaction
We are all familiar with transaction fees. There have been two clear spikes in fees per transaction, coinciding with Bitcoin price spikes. The first spike was during the all-time high in 2017, and the second during the first all-time high in April 2021.
The second all-time high in Nov 2021 when Bitcoin reached $69 000, the fees per transaction did not correlate with price. Why not? There have been tons of innovations on bitcoins layer 1, and a large rise in the adoption of the lighting network.
Number of addresses owning >0.01
This metric speaks for itself. The number of unique addresses owning more than 0.01 Bitcoin (Approximately R3 200 at the time of writing) is in a clear upward trend. The number now stands at roughly 10 million. One word: adoption!
Bitcoin HODL waves
HODL Waves is an on-chain indicator that shows the macro spending / accumulating pattern. Each coloured band shows the percentage of existing BTC supply that was last moved in a given time period. The colours range from dark red (24 hours) to purple (more than 10 years).
How to read it? Increasing young coins means that old coins are being spent which increases the liquid supply. Increasing old coins indicates that dormancy is increasing, meaning investors are accumulating and HODLing.
According to the latest update from Glassnode, 60% of BTC has not moved in a year or more. 60% of coins are owned by Diamond-handed HODLers. These entities are holding despite the volatility and bearish market sentiment.
BTC balance on exchanges
According to Glassnode, BTC on exchanges just hit a 3-year low of 2 503 613 BTC. This means that holders continue to HODL for the long term by withdrawing their assets into storage. Increased balances on exchanges normally indicate that holders are looking to sell, whereas balances withdrawn from exchanges (into hardware or software storage wallets) are indicative of long-term conviction.
Closing remarks
Of course, nobody knows whats going to happen. We are all at the mercy of the fed monetary policy. Are the fundamentals degrading, or is the price simply diverging from its true value due to cyclicality and macroeconomic factors?
As these indicators clearly show, fundamentals are strong, even though the price keeps tumbling in the short term. In our opinion, this is a clear sign of price-value divergence, and therefore presents a stellar opportunity for investors who are willing to stomach short-term volatility.
Just a friendly reminder - This is not financial advice. Always do your own research before taking a position. Content is for informational and educational purposes only.
Related Tags:
Related Articles
All articles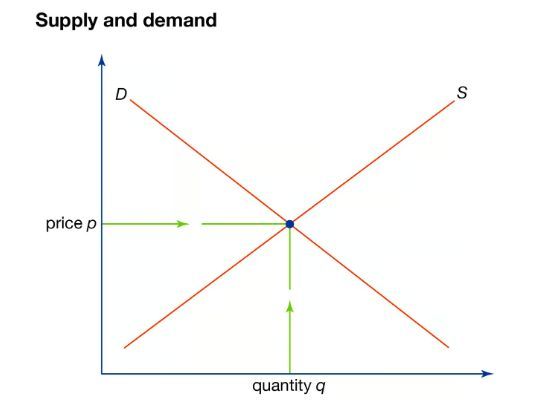
July 26, 2024, 7:27 p.m.
Why do prices go up and down?

July 27, 2024, 5:36 a.m.
UNDERSTANDING INVESTMENT HOLDING COMPANIES
July 26, 2024, 12:05 p.m.
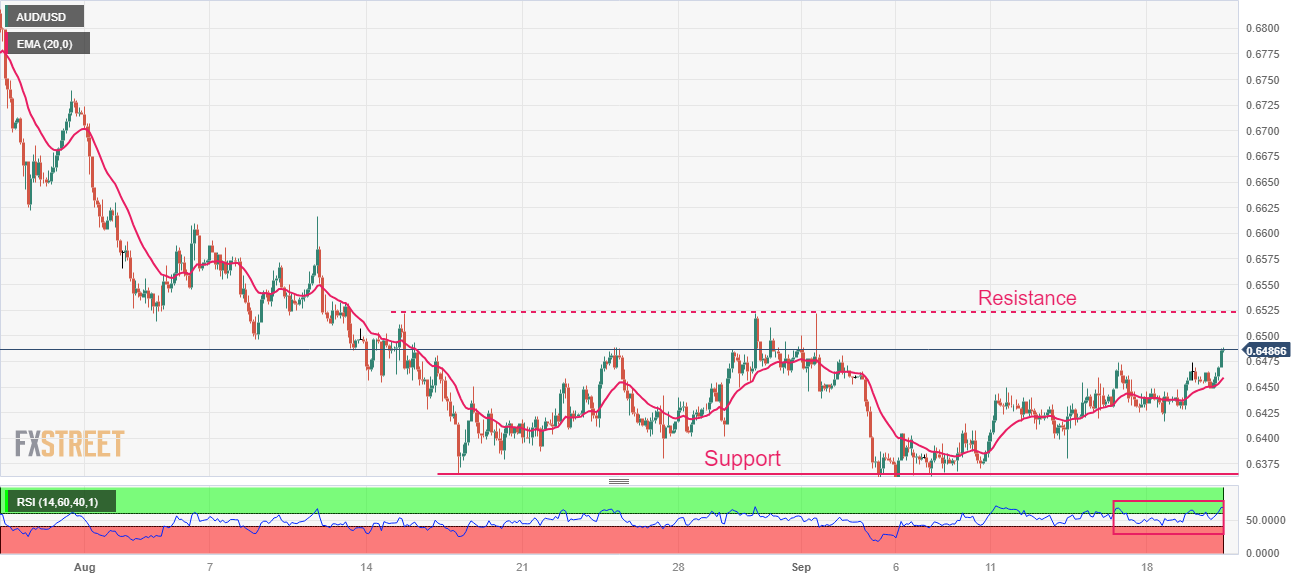
AUD/USD Market Outlook

July 26, 2024, 8:53 p.m.