July 27, 2024, 9:16 a.m.
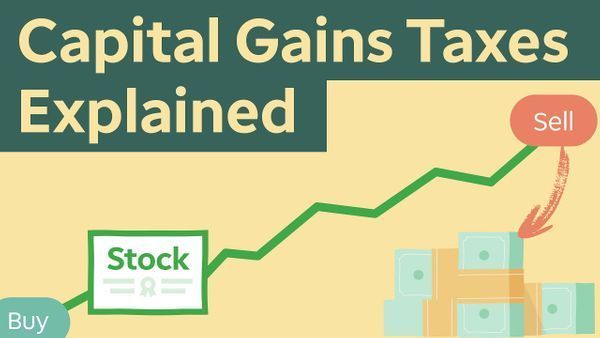
Unpacking the P/E ratio
July 17, 2023
19
88
0

Author
FinMeUpUnpacking the holy grail of financial ratios
The P/E ratio is widely regarded as the holy grail of financial ratios. As with all metrics, the P/E ratio must never be used in isolation. It does, however, offer a solid basis to start ones valuation.
A companys P/E ratio is calculated as the price per share divided by the earnings per share. The price per share is simply the current share price in the market, whilst the earnings per share is a companys earnings (or profit) divided by the number of issued shares. The higher the earnings per share, the better.
Earnings per share
Lets consider an example. Company A and B have earnings of R100 000 and R80 000 respectively. Company A has 50 000 issued shares and company B has 20 000 issued shares. The EPS of A: 100 000/50 000 = R2, and EPS of B: 80 000/20 000 = R4
Based solely on EPS, company B is the better performer. But using only EPS without considering the price, is like comparing McDonalds to Gordan Ramsey without considering the price differential. This is where the P/E ratio comes into play. It essentially considers the price you pay for the value you get.
Price per share / Earnings per share (P/E)
The P/E ratio calculates the price per share divided by the earnings per share. This is the amount an investor pays for a single rand of earnings. Lets build on our previous example.
Company A and Company B close trading at R24 and R72 a share respectively. As calculated above, the EPS of company A is R2, and the EPS of company B is R4. The P/E of A: 24/2 = 12, and the P/E of B: 72/4 = 18
This means that company A is trading at 12 times its EPS and Company B is trading at 18 times its EPS. Investors would have to spend R12 for every generated Rand of annual earnings for A and R18 per Rand of annual earnings for B. In a nutshell, company B is more expensive than company A, because investors pay more for what they get.
A company is often viewed as undervalued when its price is low relative to the earnings that the company generates. Therefore, we often look for relatively low P/E ratios when considering our investment options.
FAQs
- What is a historically good P/E ratio?
Once again, it depends on various factors, such as industry, economic cycle, nature of the business, the growth cycle of a company etc. The average historical PE for the JSE and S&P500 is around 13-15. It is best, however, to compare apples with apples. Identify the type of company based on all the variables and compare it to companies in similar conditions.
- Why do some companies not have a P/E?
Companies dont have P/E ratios if their earnings for the period is negative. This is very common for start-ups and high growth companies because they tend to have high operational expenses and/or reinvest all their earnings into new assets. Negative P/E ratios are mathematically possible, but because they are generally not accepted by the financial community, they are usually reported as "N/A".
- Why is Teslas P/E so high?
Tesla, like many other companies called growth companies, has a very high P/E ratio. The reason for the high P/E ratio is investors expect Tesla's earnings to grow rapidly.
Related Tags:
Related Articles
All articles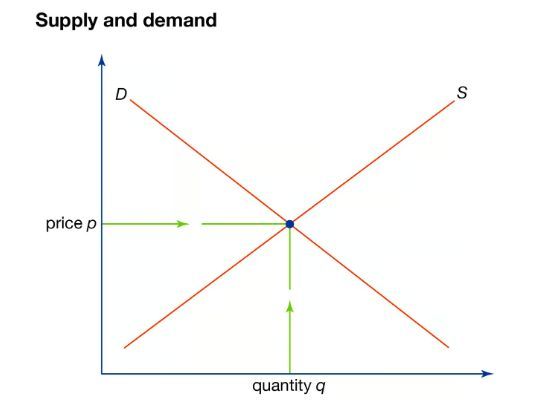
July 27, 2024, 8:28 a.m.
Why do prices go up and down?
July 27, 2024, 8:28 a.m.
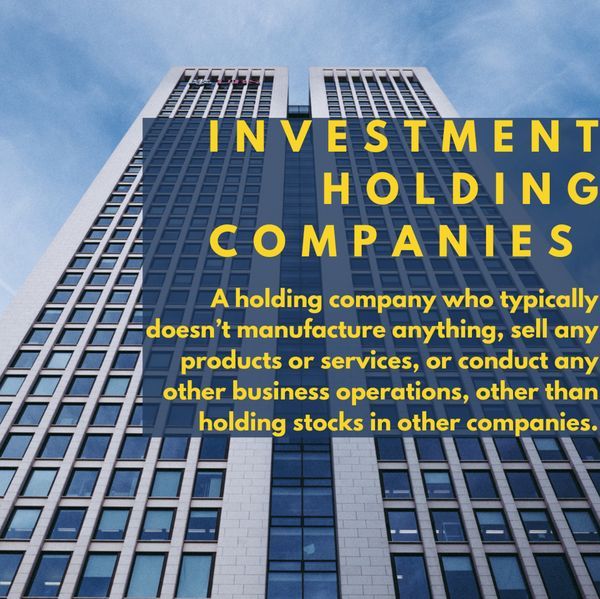
UNDERSTANDING INVESTMENT HOLDING COMPANIES
July 27, 2024, 8:28 a.m.
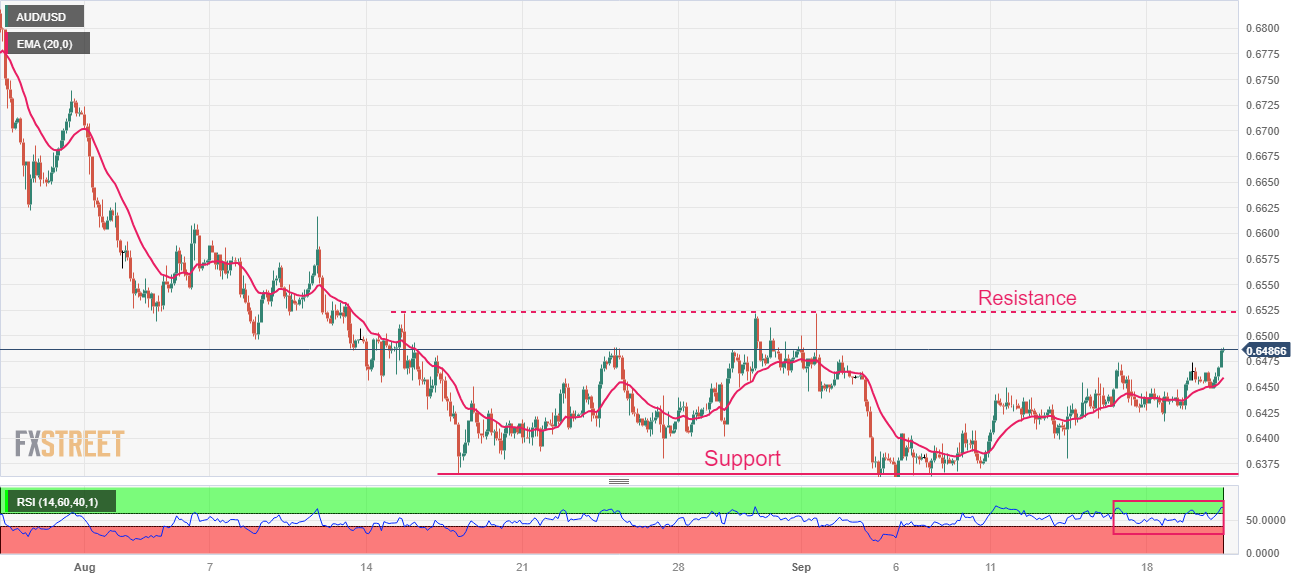
AUD/USD Market Outlook

July 27, 2024, 8:49 a.m.