
July 27, 2024, 9:16 a.m.
Stats: Shoprite vs Pick n Pay
July 17, 2023
14
75
0

Author
FinMeUpBasic financial metrics of Shoprite vs Pick n Pay.
Short-term growth
Revenue 1year
- Shoprite 17.20%
- Pick n Pay 8.30%
Net income 1 year
-Shoprite 14.70%
- Pick n Pay -3.67%
Long-term growth
15-year avg revenue growth
- Shoprite 10.27%
- Pick n Pay 6.23%
15-year avg net income growth
- Shoprite 11.08%
- Pick n Pay 5.84%
Liquidity
Cash ratio
- Shoprite 0.27
- Pick n Pay 0.08
Current ratio
- Shoprite 1.23
- Pick n Pay 0.74
Profitability
Operating margin
- Shoprite 5.65%
- Pick n Pay 2.79%
Solvency
Interest coverage
- Shoprite 3.52
- Pick n Pay 1.72
Share price
1-year
- Shoprite +6.8%
- Pick n Pay -30.24%
5-year
- Shoprite 3.83%
- Pick n Pay -51.42%
Dividend yield
- Shoprite 2.74%
- Pick n Pay 4.92%
Related Tags:
Related Articles
All articles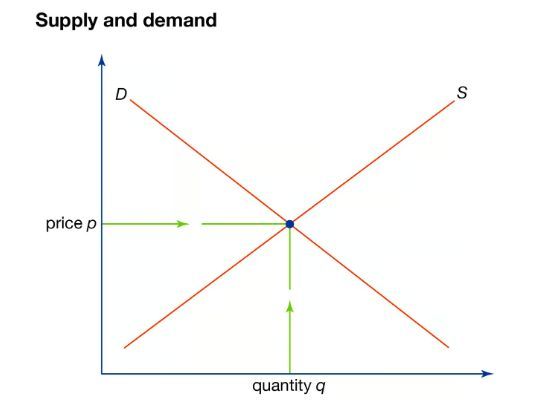
July 27, 2024, 8:28 a.m.
Why do prices go up and down?

July 27, 2024, 8:28 a.m.
UNDERSTANDING INVESTMENT HOLDING COMPANIES
July 27, 2024, 8:28 a.m.
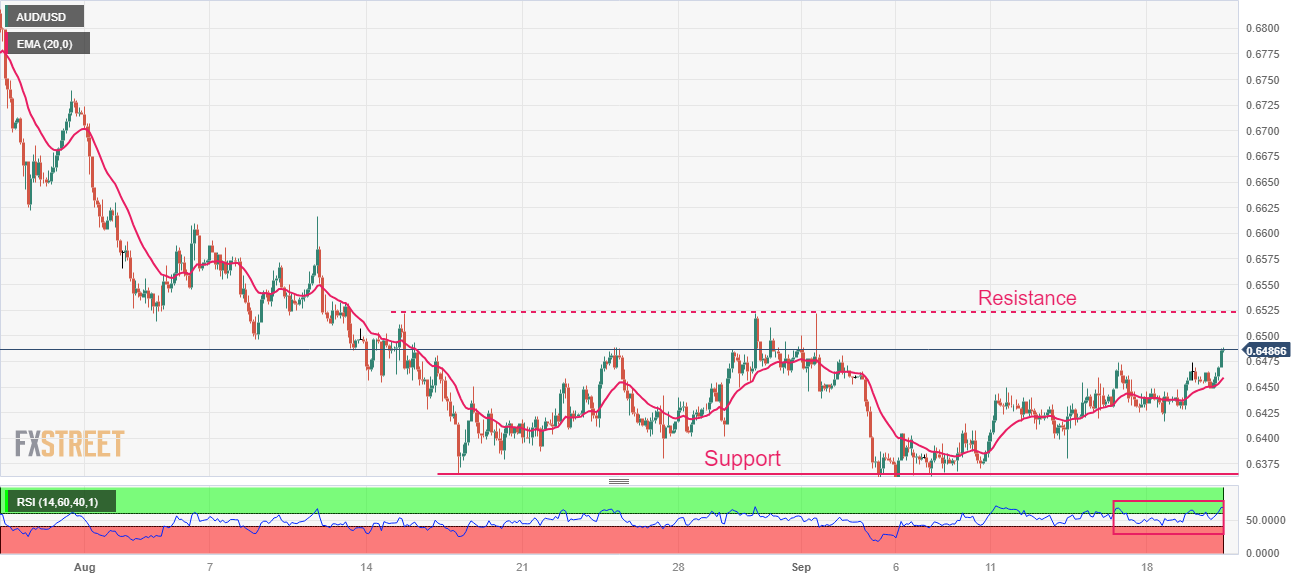
AUD/USD Market Outlook

July 27, 2024, 8:49 a.m.