
July 27, 2024, 3:04 a.m.
South African Rand Analysis.
July 17, 2023
3
116
0

Author
Lennox NgobeniCan it get worse??
Dollar Index
The US dollar has hit a 20 year high of $114 this morning. As shown in the chart above, it has touched our trend-line and currently showing some weakness at the level. The Dollar Index is a leading indicator of global currencies and most importantly, the South African Rand. Before we look at the Rand, it is wise to analyse the dollar first.
Although the US dollar currency may be presenting some weakness at $114 level, which might take index back to $111, the broader picture(last frame) is not looking too great. The index is trading well above the $107 demand-zone and given enough momentum this should take the index to the next supply-zone of $119 as shown above. But what are the implications on the ZAR ???
ZAR Chart
You will notice that there are similarities between the US Dollar and the ZAR chart. This is no coincidence. The appreciation of the dollar should result in equal deprecation of the South African Rand . We have already established the possibility of the US dollar reaching a high of $119 in the long run, which correlates to the R19/$ zone on the USD/ZAR chart. The rand is trading well above the demand-zone of R17 which correlates to the $107 demand zone on the dollar index. The short term weakness in dollar is likely to take rand to the mid seventeens. However, there is enough momentum that suggests that the local currency could trade to as high as R19/$ in the long-medium term. The forecast implies further depreciation in the local currency and appreciation in the US dollar.
YES, IT CAN GET WORSE!!
Disclaimer: None of the information shared above constitute financial advise. The information shared is just a true reflection of the author's opinion and experience. Seek financial advice from a registered financial advisor.
Related Articles
All articles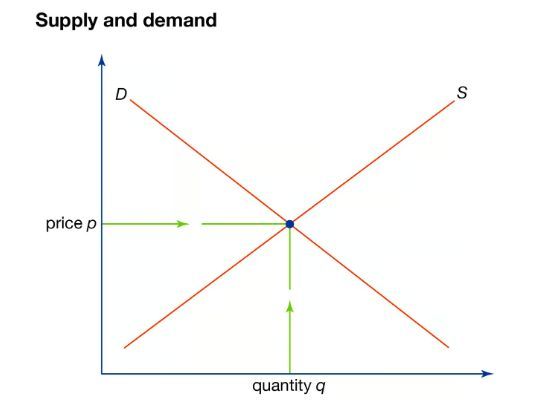
July 27, 2024, 8:28 a.m.
Why do prices go up and down?

July 27, 2024, 8:28 a.m.
UNDERSTANDING INVESTMENT HOLDING COMPANIES
July 27, 2024, 8:28 a.m.
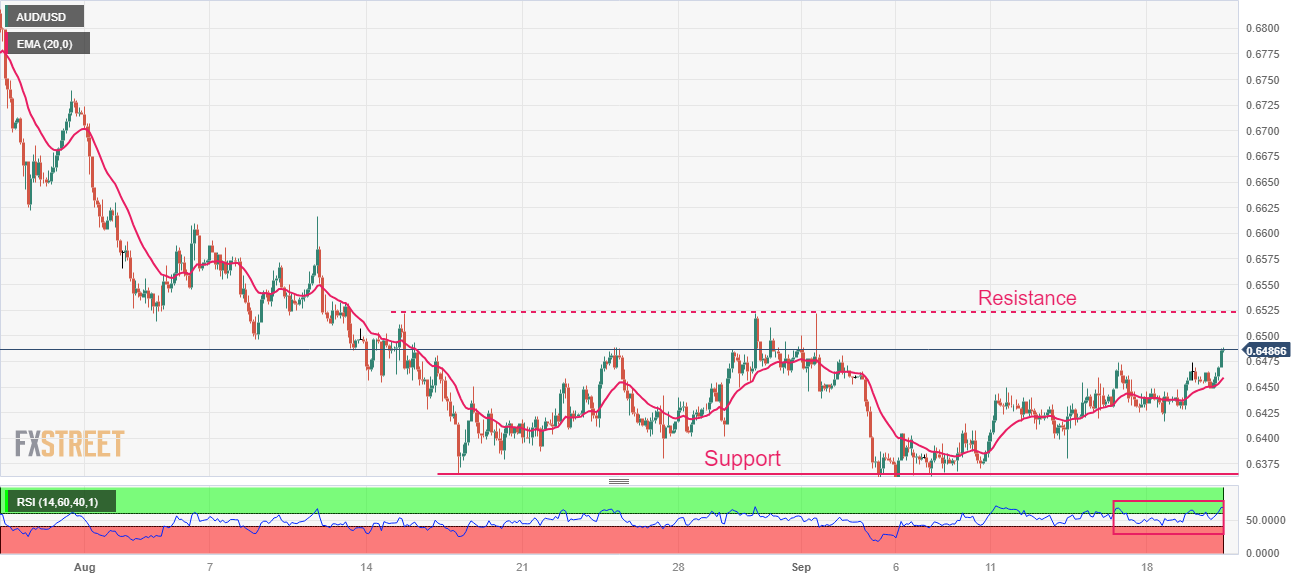
AUD/USD Market Outlook

July 27, 2024, 8:49 a.m.