July 27, 2024, 9:16 a.m.
Sasol: Buy, Hold, or Sell? Part2/3
July 17, 2023
12
74
0

Author
Charl BothaPart 1: Sasol 101 Part 2: Sasol's business model and value drivers Part 3: What is Sasol worth?
Sasol disaggregates its business into two major segments: the energy business and the chemicals business. Each of these is, in turn, divided into three business units of their own.
In the energy business, these are (coal) mining, gas and fuels. In the chemicals business, they are Chemicals Eurasia, Chemicals Africa and Chemicals America.
1. The Energy Business
The energy business value chain runs roughly as follows.
- Step 1: Sasol mines coal and extracts gas from its coal mines in SA and gas fields in Mozambique.
- Step 2: The coal and gas are then railed or piped to its city-sized Secunda and Sasolburg plants in Mpumalanga.
- Step 3: At Secunda/Sasolburg, the coal and gas go in at one end, complicated chemical and industrial things happen in the middle, and refined fuels and chemicals come out the other side.
- Step 4: The resulting fuels are sold to all the willing and able, either wholesale or retail. The coal and gas not used to make fuel is either sold as coal and gas simpliciter or used to make chemicals. More on the chemicals business later.
As you can see, the (coal) mining and gas (extraction) businesses make step 1 (and 2) of the value chain happen, while the fuels unit covers steps 3 and 4.
The question that interests me is this: what is the intrinsic value of each of these business units? To answer this question, we will need to get a reasonable fix on what sort of (sustainable) free cash flows they are likely to generate in the future. And finally, to answer that, we need to identify the key economic drivers of these units free cash flows, and then think about how they will play their respective free cash flow causing roles going forward.
Lets begin our enquiries with the coal mining unit.
1.1 (Coal) mining
What are the key value drivers of Sasols coal mining business? Well, like in any mining business, or in any business for that matter, the profit a business earns in any given year is equal to the difference between the revenue it generates in that year, and the cost it incurred to do so.
Key value driver 1: Coal prices and volumes
All else being equal, the higher the coal price, and the greater the amount of coal the mining unit sells, the greater the amount of money it makes, and thus the higher its intrinsic value. The problem: its revenue growth from price increases is limited by design, while its revenue growth from volume increases is currently being limited by production weaknesses. More specifically, on the price side, the coal business is obligated by the group to sell most of its production typically 95% at a (low) cost-plus arrangement to the fuels and chemicals units. While, on the volume side, recent production numbers paint an increasingly bleak picture.
My impressions: coal price rises will be limited by the economic needs of the much more important fuels and chemicals units, while production numbers will probably return to their 20192022 averages only in 2024. The implications: the units revenue growth will be limited and is unlikely to exceed its 2022 numbers until at least 2024.
Key value driver 2: Costs (fixed, variable and capital)
In general, a mining ventures required outlays include things like exploration costs (searching for new resources), capex (costs of building new mines, or further development of existing mines), operating costs (costs to keep the resources coming, both fixed and variable), and finally, rehabilitation costs (closing the curtains on the operations in an environmentally friendly way).
At present, Sasol coal has few capital and rehabilitation cost worries. The canaries in its coal mines are rather of an operational kind, and they number two. The first, as noted, is that its coal production profile is deteriorating, and not by design. The result: the operating cost-efficiency is suffering (same fixed cost, lower production).
Secondly, and related to the first, is that the coal that it is managing to deliver is often of an inferior quality. This is leading to production losses at Sasol fuels and chemicals, which is obviously far from ideal given the crucial economic importance of the latter.
Bottom line: Sasol coal is not producing enough coal and the coal that it is producing is lacking in quality. The result: the value of both the gas business and the fuels and chemicals business will be discounted until the market expects its operational performance to improve.
1.2 Gas
Key value factor 1: Gas sales prices and volumes
Gas volumes: The gas business extracts gas in Mozambique and sells most of it in South Africa 67% of production typically goes to Sasol fuels and chemicals, while the rest is sold to local third parties. Unlike the coal business, the gas businesss production profile has been steady since 2019. I see no reason why this will change for the worse anytime soon.
Gas prices: During the last four years, the gas business charged its South African fuels and chemicals sister company an average of about R56 per thousand cubic feet of product the corresponding third-party average sales price was R119 per thousand feet of gas, give or take.
As you can see, the difference in internal and external pricing is significant, which explains why even though external sales volumes are typically only half of those sold internally, external gas revenues are often double those generated from internal activity. In other words, while internal selling prices cover the gas business basics, its really the external gas price that drives most of its value.
But here things get interesting, for, by law, there is a cap on what Sasol is allowed to charge its local third-party customers, something called the maximum allowable (gas) price. What this price should be is currently the subject of a dispute (between Sasol and Nersa). Sasol wants to charge third parties R141 per thousand cubic feet of gas, while Nersa is adamant that R70 per thousand cubic feet is much more acceptable.
I have no idea how this disagreement will ultimately play out butgiven that the average gas price per thousand cubic feet during the last four years including the presumably low COVID-19price was R119 per thousand cubic feet, I find it hard to believe the sustainable gas price going forward wont be much closer to R119 than Nersas R70 (per thousand cubic feet).
Key value factor 2: Costs
The gas business, like the coal mine business, is essentially a mine. It just happens to mine gas instead of coal. Hence, the kind of cost it faces is very similar: exploration and capital costs (searching for and developing new gas fields) fixed and variable operating costs to keep the show on the road, and rehabilitation costs to ensure an eventual respectable exit.
The gas business disposed of its Canadian and rest-of-Africa assets in 2020 with its attendant revenues and costs which means its tricky to gauge whether managements 2021/2022 cost management performance is indicative of things to come, or just the normal year-on-year variability common in complicated businesses. What the numbers do show is that management was able to reduce the fixed cost base in 2022 without the operating capacity of the business reducing. On the other hand, the cost of sales number had a bit of a blowout rising by 64% which is not something you want to see and certainly not something you want to continue seeing. The 2023 numbers should provide greater clarity. I will assume that average two-year margins (for both gross profits and operating profits) are sustainable.
1.3 Fuels
Despite Sasols increasingly international venturing, the largely SA-based fuels (and chemicals) business is still the stallion in its stable of ventures. Here I focus on the fuels part.
The basic economics of the fuels business is simple. It turns coal and gas into refined fuels: petrol, diesel, jet fuel and the like. The difference between the costs of its coal and gas feedstocks and the basket price it receives for its refined fuels output is its refining margin. Identify and add the costs required to manage and do the actual refining, and you will get a good sense of how profitable and hence valuable this enterprise is.
Key value factor 1: The rand oil price (ZAR/oil price)
The single most important factor driving the value of the fuels business and Sasol as a whole for that matter is the ZAR/oil price and Sasol has no control over it. This wouldnt be a vexing valuation problem if the ZAR/oil price was reasonably and consistently predictable. Alas, its not. Or at least Im not aware of anybody thats particularly good at it.
Its not difficult to see why. After all, you would have to be good at both forecasting one of the most volatile currencies in the world viz. the rand and be more than proficient at doing the same for the oil price. A tough ask, and one that the history of such forecasting exercises suggests is probably beyond most of us. The only solution I can think of is to try and smooth out the ups and downs of the relevant price cycle by going with historical averages, and not to try and predict the future. In other words, lets see what Sasols fuel business is worth if future prices track historical ones (more on that shortly).
Key value factor 2: Production and sales volumes
In the last couple of years bar 2020 the ZAR/oil price hasnt dipped below the fuel units cost of production, which means the higher the units fuel production, the higher the top line. And vice versa.
Refined product sales averaged about 56 million barrels per year during the last four years, with yearly highs and lows of 60 million barrels and 53 million barrels in 2019 and 2020 respectively. I will assume the company returns to what I think is its sustainable sales rate 56 million barrels in 2024, as the most recent data indicates that 2023 sales will be just north of 50 million barrels.
Key value factor 3: Costs and margins
I will assume the fuels unit manages to maintain its four-year average operating profit margin, and although I do make some margin adjustments for differences in expected production in the short term, my primary aim is to estimate what Sasol fuels sustainable operating margin is. My best guess is that the 20192022 average is as good a representation of the latter as any.
2. The Chemicals Business
As noted, Sasol Chemicals is divided into three main business units: Chemicals Africa, Chemicals Eurasia, and Chemicals America. Essentially, each does the same thing transforming fossil fuels (coal, oil and gas) and a few other chemical goodies into various petrochemicals. Where they differ is in the scale of their respective operations, their product foci, and in their choice of primary fossil fuel feedstock. Lets consider each briefly.
The chemicals basket and basket prices: Sasol divides its chemical product suit its chemicals basket if you will into four general kinds: base chemicals, essential care chemicals, advanced materials, and performance solutions. For our purposes, its not crucial to know exactly what these products are, except to say that, among the four, base chemicals is the cheapy, whereas the others are more chemically special, and hence pricier.
What is important to know is that although each of the three units produces the same products for the most part their specific chemical baskets differ because they produce them in different proportions. For example, whereas base chemicals dominate the product baskets of Chemicals Africa and Chemicals America (more than 60% of the total of each), Chemicals Eurasia doesnt produce any, which explains why the latter receives a great deal more money for its product suit than either of the former $1,998/ton vs. $993/ton (Chemicals Africa) and $1,317/ton (Chemicals America) [2019 to 2022 averages].
(Financial) scale: Chemicals Africa is the chemicals segments economic workhorse, with Chemicals Eurasia and Chemicals America adding their weight in second and third place respectively. For example, on average, Chemicals Africa generated R56.2 billion in revenue and R12.9 billion in operating profit per year since 2019. The corresponding revenue figures for Chemicals Eurasia and Chemicals America were R45.7 billion and R30.4 billion respectively, and the operating profit numbers R3.5 billion and R1.8 billion each.
Fossil fuel feedstock: As explained previously, Chemicals Africas primary feedstocks are coal and gas, the bulk of which it sources internally. On the other hand, Chemicals America the (in)famous Lake Charles venture primarily uses gas (ethane specifically), which it sources from third parties, while Chemicals Eurasia mostly uses Naphtha (similar to petrol) in its chemical transformations.
The economic implications of these differences are two-fold. Firstly, in an increasingly environmentally conscious world, Chemical Africas dirty coal will have to go. This is going to be expensive. The good news is that it has relatively easy access to and some pricing control over the next best thing, gas. Secondly, the original economic attraction of the United States and the reason why Lake Charles was built in the first place was and is its access to cheap gas. Were the gas ever to become much more expensive, owing to massive recent and expected increases in LNG exports to the EU for example well, you can imagine the economics of Lake Charles could suddenly become a lot less appealing.
Related Tags:
Related Articles
All articles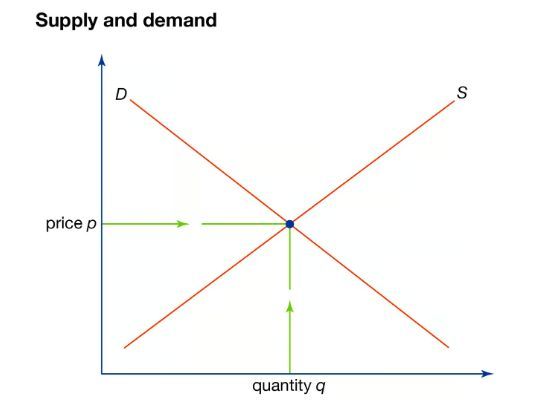
July 27, 2024, 8:28 a.m.
Why do prices go up and down?
July 27, 2024, 8:28 a.m.
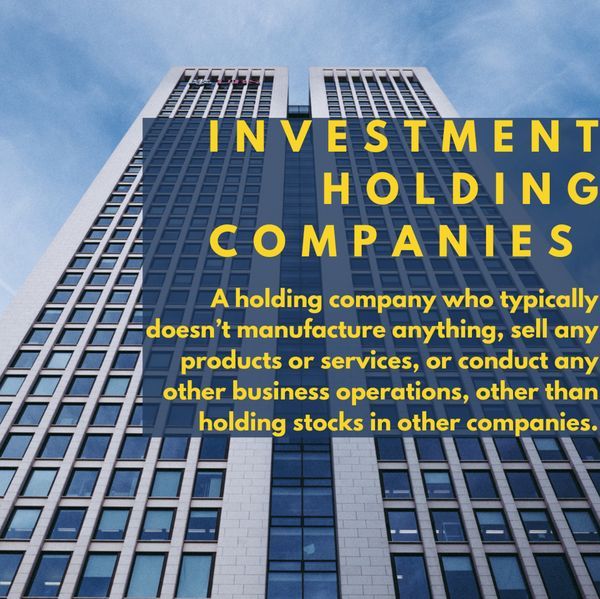
UNDERSTANDING INVESTMENT HOLDING COMPANIES
July 27, 2024, 10:59 a.m.
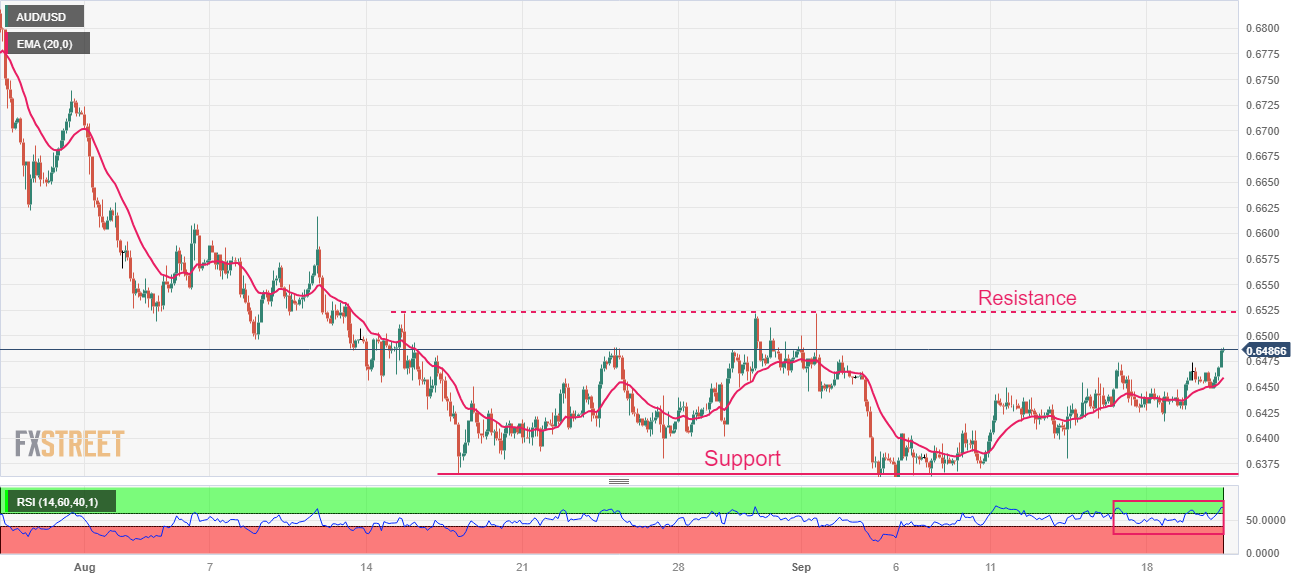
AUD/USD Market Outlook

July 27, 2024, 8:49 a.m.