
July 27, 2024, 3:04 a.m.
Qualcomm Deep Dive [Part 2]
July 17, 2023
1
72
0

Author
Josh ViljoenAnalysis of the Financial Performance of QCOM
In the first part of the deep dive, we took a look into the business model of Qualcomm and how they operate as well as taking a look at the three core business divisions through which the company operates. In this part of the deep dive, we will be taking a look at the financial performance of the entity over the recent financial years.
Revenue
The business has seen impressive revenue growth figures in the most recent two financial years. While revenue was mostly flat from 2018 to 2020, the business saw substantial growth in 2021 and 2022. Full-year revenue has grown from $22.70 billion in 2018 to $42.14 billion in 2022. This corresponds to an impressive revenue CAGR (compounded annual growth rate) of 13.17%. I typically like to invest in stocks that are growing revenue by a CAGR of at least 5% and thus QCOM is outperforming that hurdle.
Profit
Qualcomm has impressively high gross profit margins that have ranged from 54% to 65% over the past 5 years. The gross profit margin in June 2022 was 58%. Companies with high gross margins tend to be more resilient to recessionary periods as they can absorb cost increases while still turning a profit in these difficult economic environments. I usually look to invest in companies with a gross margin in excess of 15%.
The entity also has high operating margins, and these have typically ranged from 25% to 35% over the past 5 years. The entity however saw a significant drop in the operating margins during 2018 and this is a cause for concern. Upon further investigation, it was noted that this was largely due to an increase in other operating expenses. Operating profit margins for the trailing 12 months are just below 36%. When assessing operating profit margins, I usually look for a company with consistent operating margins in excess of 10%.
Net margins have trended around 25% and have steadily risen over recent quarters. The company has generated a net profit in all of the 10 most recent financial periods except for 2018. The net loss in 2018 was caused largely by a large income tax provision and this is likely due to an isolated once of transaction. Overall, the profit margins of Qualcomm are exceptionally high, and the management has done well to control costs and convert growing revenue into resulting growing profit. I usually look for a company with an average net profit margin in excess of 5% and Qualcomm has far exceeded this.
Cash Flow
Qualcomm has been consistently cash-flow positive over the past 5 financial periods. Free cash flow has grown from $3.11 billion in 2018 to $6.70 in the trailing twelve months. Over the past 5 years, the company had an average free cash flow yield of 5.3%. In comparison, the average FCF yield in the US IT sector is 1.8% and Qualcomm is thus well above the industry average.
In the next part of this deep dive, we will take a look at the financial position of Qualcomm as well as the valuation multiples the share is trading at.
Related Tags:
Related Articles
All articles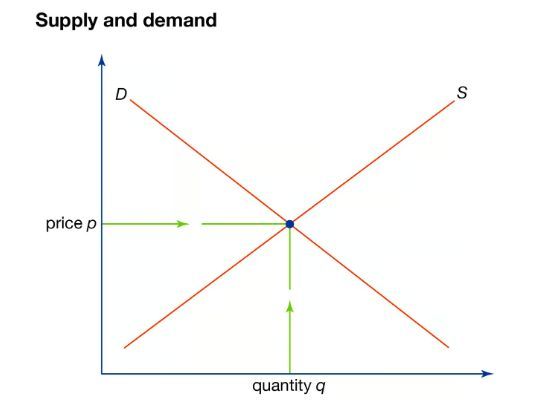
July 27, 2024, 6:24 a.m.
Why do prices go up and down?
July 27, 2024, 5:36 a.m.
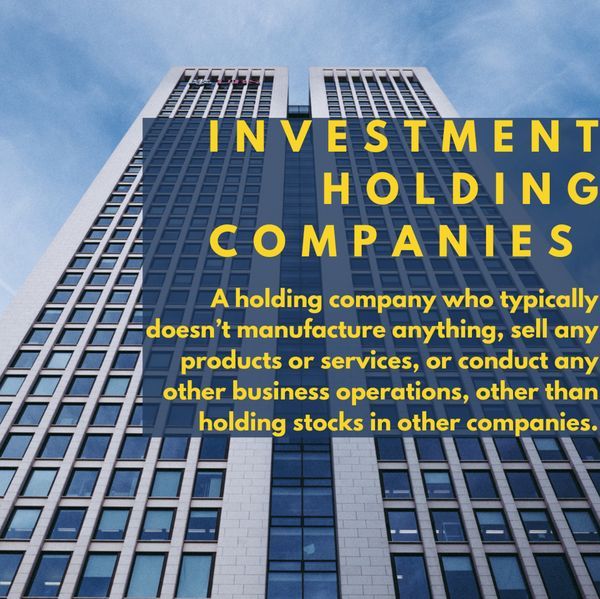
UNDERSTANDING INVESTMENT HOLDING COMPANIES
July 26, 2024, 12:05 p.m.
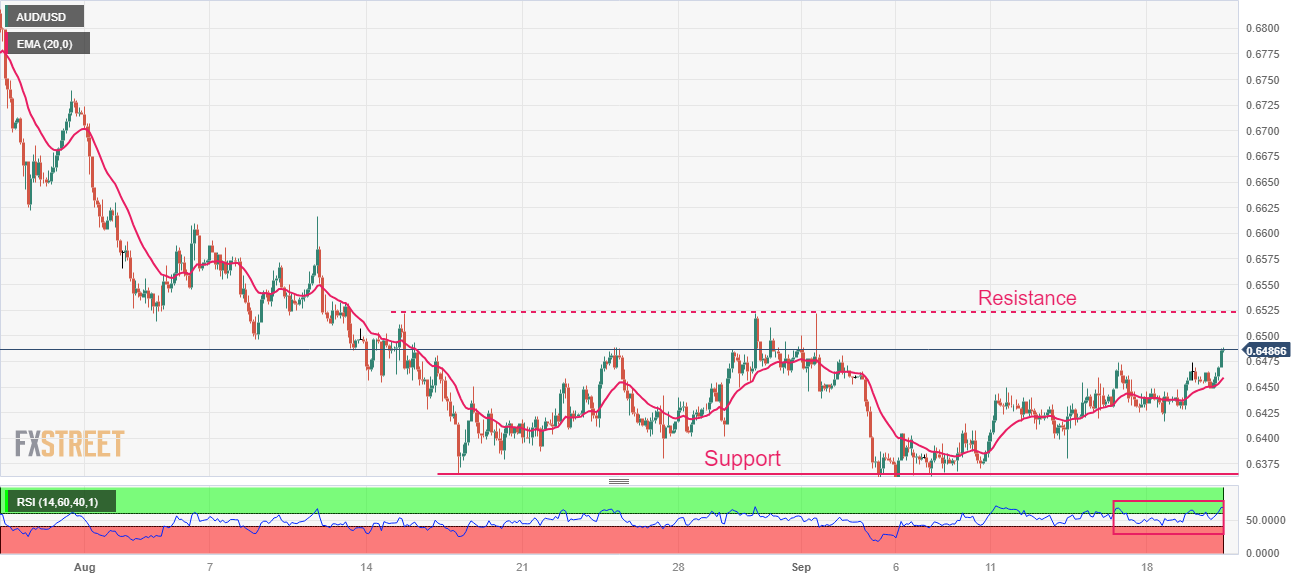
AUD/USD Market Outlook

July 26, 2024, 8:53 p.m.