
July 27, 2024, 3:04 a.m.
PBT Group
July 17, 2023
4
66
0

Author
Josh ViljoenStock research report
Company Name: PBT Group
Ticker: PBG
Market Capitalisation: R976m
Share Price: R9.30
Industry: ICT / Data Analytics
Company Overview
PBT was a spin off from Prescient which was a financial services and business technology service provider. PBT Group focuses exclusively on business technology and data analytics. They provide the following services: strategic and advisory, data engineering, data visualisation, managed services and application development.
Investment Thesis Summary
PBT is a well run and asset-light business trading in an industry with high growth forecasts and strong tailwinds. Management is focused on efficiency and returning capital to shareholders. They have low capex requirements and do not require capital investment to sustain returns.
Key Risks
PBT is a small cap stock with low liquidity and thus susceptible to above average market spreads . They have begun investing into expansion in Europe and Australia which is an unproven market for the company and may not yield the expected returns. The ICT and data analytics industry is highly competitive and focused on innovation. The business may be subject to disruption if they cannot keep up with the technology of competitors.
Financial Performance and Financial Position
- Revenue has grow from R556m (2018) to R976m (2022) at a CAGR of 12%
- Gross margin remained consistent around 25%
- Operating margin has been improving YoY from 7.93% (2019) to 13.64% (2022)
- Net margin is relatively low at 6.89% for 2022 however it has been showing improvement YoY
- FCF to net income is close to 1 and the business is thus converting most of its net profit to FCF
- Almost no debt on the balance sheet and D/E ratio is close to 0%
- High interest coverage ratio of 76
- Current ratio is sound at 1.94
Key Metrics
P/E: 12.35
P/FCF: 8.37
Earnings Yield (2019 - 2022 Average): 10.12%
FCF Yield (2019 - 2022 Average): 14.66%
Valuation
SimplyWallStreet DCF Fair Value: R14.92
FinBox EV/EBITA Fair Value: R12.71
FinBox P/E Fair Value: R10.80
FinBox P/B Fair Value: R9.91
FinBox EV/Revenue Fair Value: R11.69
FinBox Dividend Discount Model Fair Value: R15.52
FinBox DCF with EBITDA Exit Multiple Fair Value: R17.29
Average Fair Value: R13.26
Margin of Safety Discount: 20% (higher risk due to small cap stock)
Adjusted Fair Value: R10.61
Expected Return: 14.1%
Related Tags:
Related Articles
All articles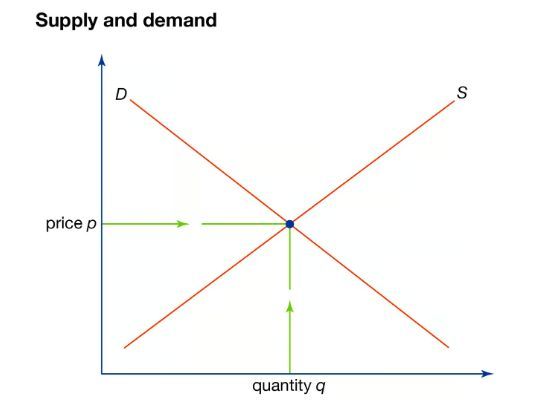
July 26, 2024, 7:27 p.m.
Why do prices go up and down?

July 26, 2024, 12:05 p.m.
UNDERSTANDING INVESTMENT HOLDING COMPANIES
July 26, 2024, 12:05 p.m.
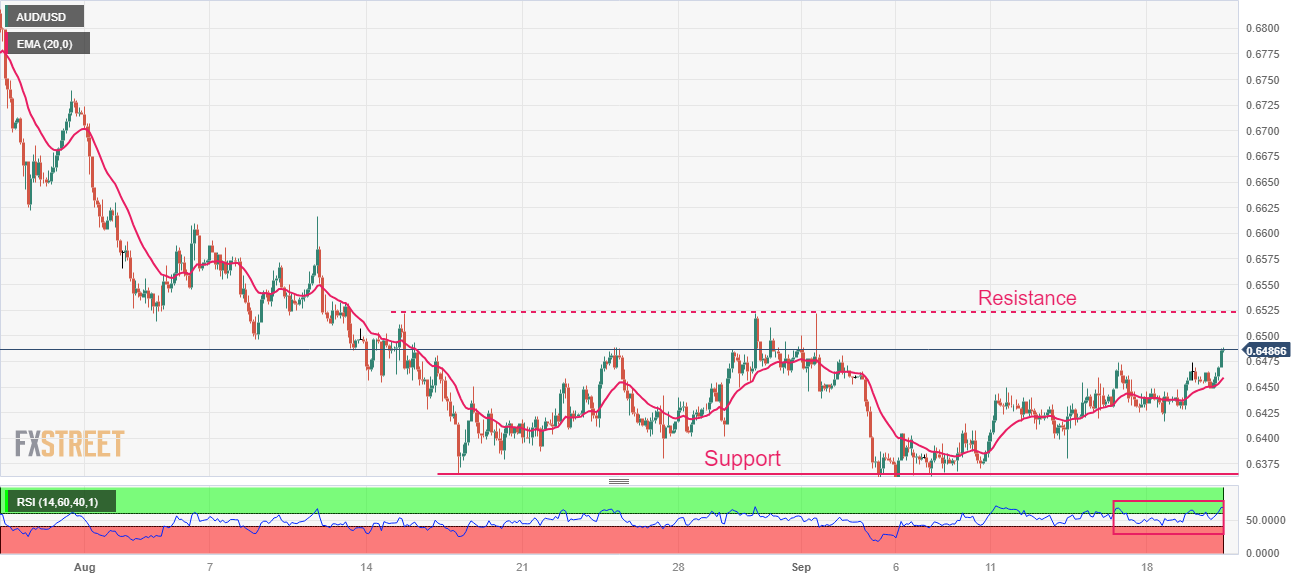
AUD/USD Market Outlook

July 26, 2024, 8:53 p.m.