
July 27, 2024, 3:04 a.m.
Nike vs Under Amour vs Lululemon: Revenue and Profit [Part 1]
July 17, 2023
1
54
0

Author
Josh ViljoenIn this first segment we compare the revenue and profit of NKE, UAA and LULU
The enduring health and wellness trend continues to be the primary driver of growth in the fitness apparel market, pushing consumers to spend on sportwear and activewear. A consumer focus on a healthy lifestyle and rising level of health-consciousness are making people get selective regarding apparel for gym sessions, personal training and casual work. Increasing engagement in sports and adventurous activities like cycling and hiking has favoured the market expansion. Fitness influencers have also played a role in promoting active wear and attracting consumers. Companies like Nike, Under Armor Lululemon are some of the big players in the industry and hold a large percentage of market share.
You may be wondering which of these companies present the best investment opportunity? In this three-part series we will unpack the financial statements and find out which company offers the best investment opportunity. In this first segment we will focus solely on the Income Statement of each of the three entities and unpack their financial performance by dissecting their revenue and profit.
Revenue
In terms of size of revenue, Nike generates significantly more than Under Armor and Lululemon. This is to be expected since Nike is the largest company of the three in terms of market capitalisation. For the most recent financial year Nike generated $44.54 billion in revenue, while Under Armor generated $5.68 billion and Lululemon $6.26 billion.
When it comes to revenue growth there is one standout winner and that is Lululemon. Over the last five years Lululemon has grown revenue from $2.65 billion to $6.26 billion. This equates to an impressive revenue compounded annual growth rate of (CAGR) of 19%.
The compound annual growth rate (CAGR) is the rate of return (RoR) that would be required for an investment to grow from its beginning balance to its ending balance, assuming the profits were reinvested at the end of each period of the investments life span.
Nike in comparison has only been able to grow revenue at a CAGR of 5% while Under Amor has only been able to grow revenue at a CAGR of 3%. It should be noted however that it is much harder for a more established company like Nike with much larger revenue to grow at a high rate like a smaller company such as Lululemon.
Gross Profit
Once again Lululemon has dominated Nike and Under Armor in terms gross profit growth and gross profit margins. Lululemon has been able to grow its gross profit at a CAGR of 21% over the past 5 years. This is higher than the revenue CAGR of 19% which tells us that the company has been able to improve its profit margins by either being able to charge a higher premium for their products, or by reducing costs through economies of scale. Lululemon has been able to improve its gross profit margin from 53% to 58% over the past 5 years. This is a very healthy profit margin and highlights that the brand is able to charge a large markup on the product due to the strong brand presence and the higher perceived quality.
Economies of scale refer to the cost advantage experienced by a firm when it increases its level of output. The advantage arises due to the inverse relationship between per-unit fixed cost and the quantity produced. The greater the quantity of output produced, the lower the per-unit fixed cost.
Nike has been very consistent when it comes to their gross profit margin. Nike has had an average gross profit margin of 44% over the past 5 years and has not seen much variability in the profit margin. The growth in gross profit has been in line with that of revenue indicating that margins have neither improved nor deteriorated.
Under Armor has seen some healthy improvement in the gross margin over the most 5 financial periods. The gross margin has improved from 45% all the way to 50%. This improvement in margin has result in gross profit growth exceeding revenue growth due to cost reductions.
Operating Profit Margin
Once again Lululemon takes the cake when it comes to operating profit. The company has achieved an average operating profit margin of 21% over the last 5 years. Operating profits have grown at a rate of 23% per annum exceeding revenue growth. This shows investors that management have done well in being able to control costs by converting on average 22% of every dollar of revenue into operating profit.
Nike has an average operating profit margin of 12% and has grown operating profits at a CAGR of 8%. Under Amor have an average operating profit margin of 4% and have grown operating profits at a CAGR of 28%. This high grown rate is due to the company coming off an extremely low operating profit base.
Net Profit
Again, Lululemon has managed to edge out the competition in terms of net profit margins and growth. The average margin over the last 5 years was a solid 14% with the margin improving from 10% in 2018 to 16% in 2022. Net profit has grown at a whopping 30% over this period.
Nike is not too far behind Lululemon in terms of net margin. Nike has achieved an average margin 10% over the 5 years with the best performance taking place in the most recent year. Net profit growth has been 6% a year and is largely in line with revenue growth.
In terms of net profit Under Armor performance has been nothing short of dismal with an average margin of -1% over the last 5 years. This means that on average the firm is making a loss year on year, and this is a big no for me when it comes to making an investment decision. Under Amor was however profitable in the most recent financial period but took a beating in the pandemic with a net loss for the year exceeding half a billion dollars.
Conclusion
When taking a look at the income statement of the three respective competitors it is clear that Lululemon is the best performer in terms of both revenue growth and profitability. It is important to keep in mind that we however want to buy a great company at a fair price. In the final segment of this three-part series, we will take a look at the valuation of the companies and what a fair price would be to pay for each company respectively. In the next segment we will take a look at the financial position of each of the three companies.
Related Tags:
Related Articles
All articles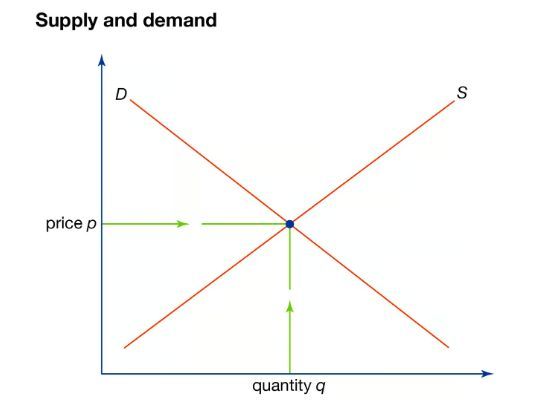
July 27, 2024, 8:28 a.m.
Why do prices go up and down?
July 27, 2024, 8:28 a.m.
UNDERSTANDING INVESTMENT HOLDING COMPANIES
July 27, 2024, 8:28 a.m.
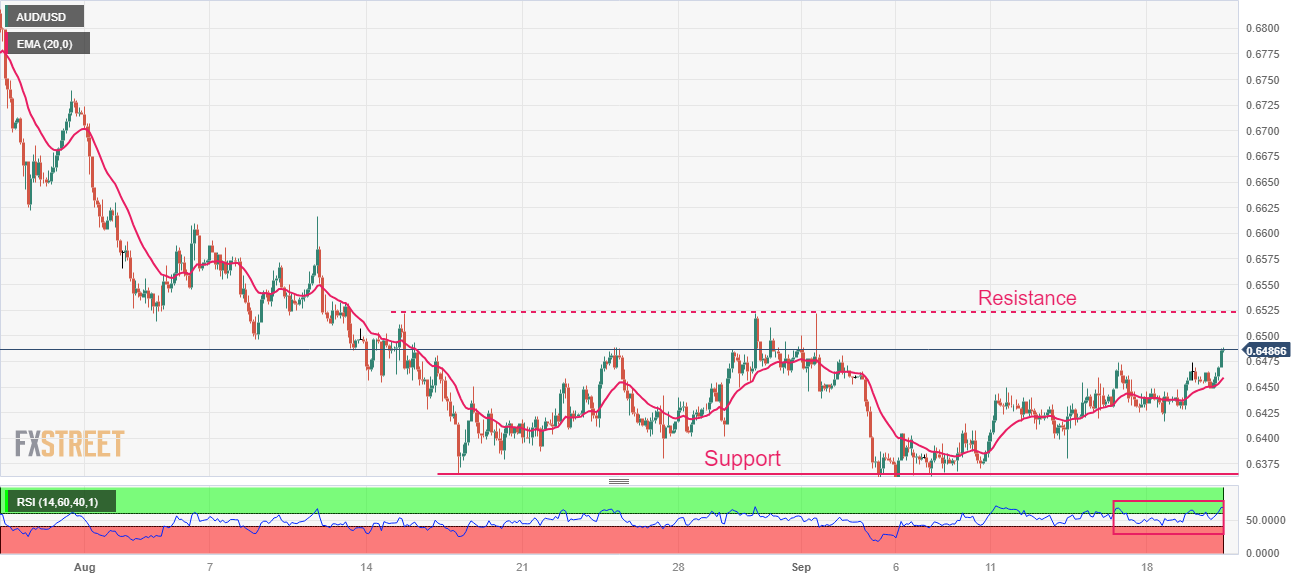
AUD/USD Market Outlook

July 27, 2024, 8:49 a.m.