
July 27, 2024, 3:04 a.m.
MTN
July 17, 2023
14
108
0

Author
Lennox NgobeniTechnical Analysis
Monthly Chart
Worst case scenario:
MTN has taken a huge 15% punch from its monthly high of R160 and has closed the week (22-26 August) just above R133/share. The stock is presenting a potential head and shoulder (bearish signal) on a monthly chart and a strong bearish pin-bar as shown on the left chart above. The strong bearish energy and completion of the head and shoulder have enough momentum to drive price to as low as R100/share, this will be a drawback of ~24% from current price. This is my foreseeable worst case scenario on the stock price.
Daily chart
The daily chart is also presenting some interesting data. As shown in the chart above, the stock has recently broken below our R140 support and has nullified the zone as a buy-zone. The stock is looking to test a new support/buy-zone at R125/share, this is my next area of interest and will be looking at buying opportunities. The stock has broken out of an uptrend (shown on the chart) and this another bearish confirmation that can potentially take price to the buy-zone of R125/share.
Price Targets
- My first price target is at R140/share from a buy-zone of R125.
- Second target is at R160/share from a buy-zone of R125 or R100
The stock is unlikely to trade back above R160/share in the year 2022.
Disclaimer: None of the information shared above constitute financial advise. The information shared is just a true reflection of the author's opinion and experience. Seek financial advice from a registered financial advisor.
Related Tags:
Related Articles
All articles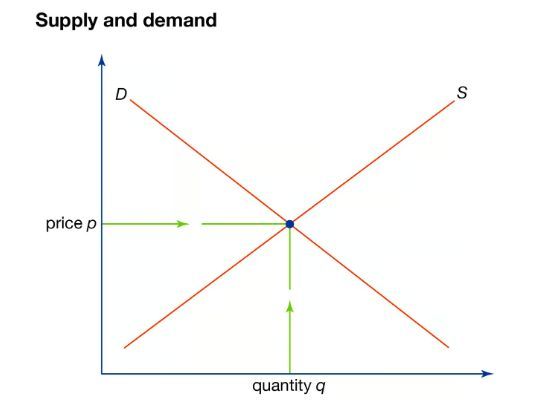
July 27, 2024, 6:24 a.m.
Why do prices go up and down?

July 27, 2024, 5:36 a.m.
UNDERSTANDING INVESTMENT HOLDING COMPANIES
July 26, 2024, 12:05 p.m.
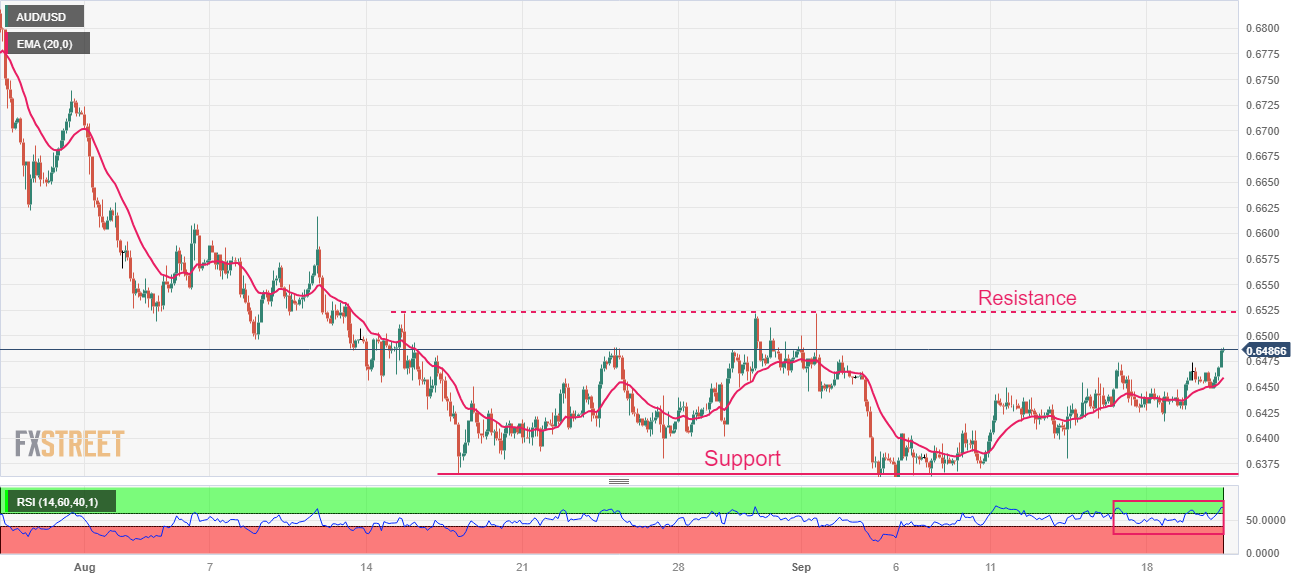
AUD/USD Market Outlook

July 26, 2024, 8:53 p.m.