
July 27, 2024, 3:04 a.m.
Meta ($FB) Technical Analysis
July 17, 2023
22
62
0

Author
Josh ViljoenWhat can we expect from the $FB share price in the months to come based on the trading chart?
Weekly Chart
When looking at the weekly chart for Meta we can see that there is a clear gradual uptrend as evidenced by the black trend line in Figure 1. This trend line has been retested three times. Once in 2019, 2020 and again in 2022.
Trendlines are easily recognizable lines that traders draw on charts to connect a series of prices together or show some data's best fit. The resulting line is then used to give the trader a good idea of the direction in which an investment's value might move.
A trendline is a line drawn over pivot highs or under pivot lows to show the prevailing direction of price. Trendlines are a visual representation of support and resistance in any time frame. They show direction and speed of price, and also describe patterns during periods of price contraction.
The relative strength index has gone into oversold territory on all three occasions of retesting this trend line. Based on past price action after reaching oversold territory and retesting the trend line the share price has recovered and reached new all-time highs.
The relative strength index (RSI) is a momentum indicator used in technical analysis that measures the magnitude of recent price changes to evaluate overbought or oversold conditions in the price of a stock or other asset. The RSI is displayed as an oscillator (a line graph that moves between two extremes) and can have a reading from 0 to 100.
Traditional interpretation and usage of the RSI are that values of 70 or above indicate that a security is becoming overbought or overvalued and may be primed for a trend reversal or corrective pullback in price. An RSI reading of 30 or below indicates an oversold or undervalued condition.
Buying at or close to current levels, where the price is retesting the trend line and is in oversold territory thus provides an attractive risk to reward opportunity if the price holds above the trend line.
A close this week in the green and above the trend line is expected, off the back of better than forecasted earnings which were announced on 27 April. While revenue came in slightly lower than forecast, earnings were 6.5% higher than forecasted for Q1 of 2022.
Daily Chart
$FB is currently trading well below the 200 day moving average (yellow line in Figure 2). The 200 day SMA (simple moving average) is often used by traders to gauge the overall long term trend. Should the price revert to the 200 SMA this may act as a level of resistance. The price is currently testing the short-term 50 day SMA (red line in Figure 2). A close above this level could be indicative of a change in the momentum and a start of momentum to the upside.
This upside momentum could see $FB trading back up towards $290 to close the gap left when the share plummeted from $290 to $250 in February. I would thus use $290 as my first profit target since gaps tend to fill more often than not. For those looking to trade the stock, stop losses can be placed at $170/175.
Related Tags:
Related Articles
All articles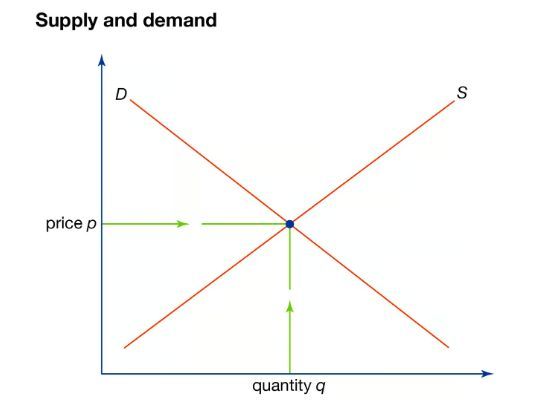
July 27, 2024, 6:24 a.m.
Why do prices go up and down?

July 27, 2024, 5:36 a.m.
UNDERSTANDING INVESTMENT HOLDING COMPANIES
July 26, 2024, 12:05 p.m.
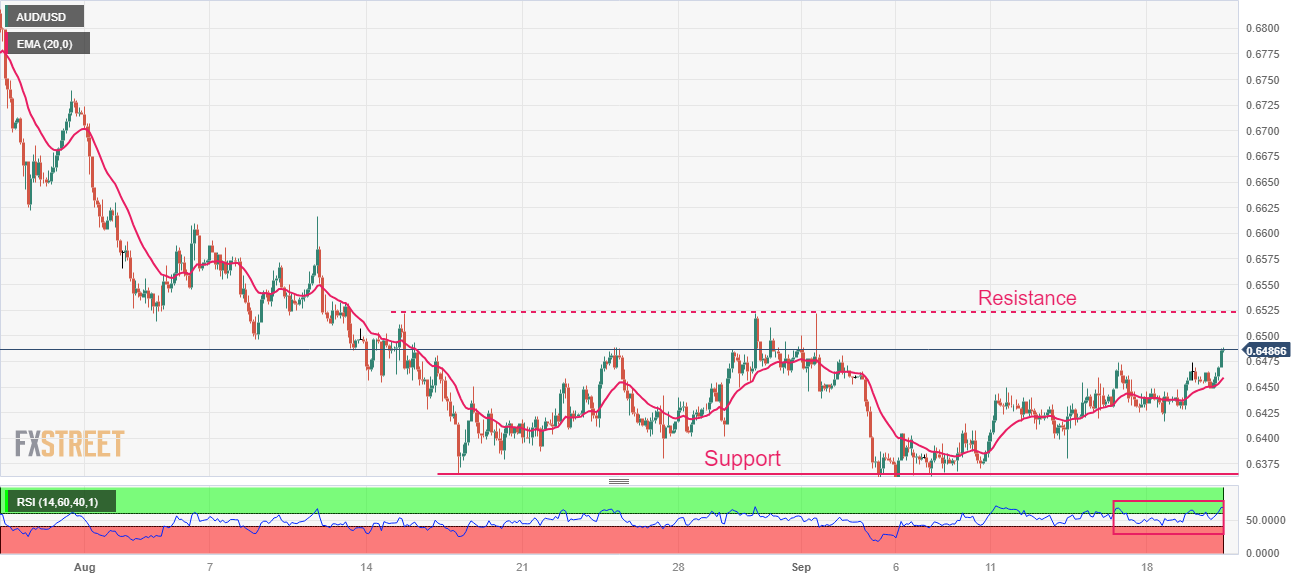
AUD/USD Market Outlook

July 26, 2024, 8:53 p.m.