
July 26, 2024, 8:53 p.m.
Investing Fundamentals: Solvency and Liquidity [Part 2]
July 17, 2023
2
83
0

Author
Josh ViljoenSolvency and liquidity should form a key part of your research when making an investment decision
What is solvency and liquidity?
Solvency and liquidity are key teams used to assess the financial health of an entity. Assessing the solvency and liquidity position of a business should form an important part of your investing research process when deciding whether or not to invest in a business.
Solvency is the ability of a business to meet its long-term financial commitments. Liquidity on the other hand is the ability of a business to meet its short-term obligations. Liquidity also refers to how easily an asset can be converted an asset to cash. The quicker an asset can be converted to cash without affecting its market price the more liquid the asset is.
Which assets are more liquid than others?
Liquidity describes the degree to which an asset can be quickly bought or sold in the market at a price reflecting its intrinsic value. Cash is universally considered the most liquid asset because it can most quickly and easily be converted into other assets. Listed shares trading on a stock exchange are highly liquid assets that can be bought or sold with ease. Smaller listed companies that have a low trading volume on the stock exchange might have lower liquidity as there may not always be a high volume of buyers and sellers. In such an instance you would see a large spread between the bid and the ask price of the share.
On a typical balance sheet an entity may have the following assets which are listed in order of most liquid to least liquid:
- Cash includes physical cash an entity holds as well as cash held in a bank account
- Listed securities consist of stocks and bonds that are traded on an active exchange
- Accounts receivable relates to amounts owing by customers for goods received or services rendered when an entity sells on credit. An entity typically expects to receive these amounts within 12 months. However, should the customer experience financial difficulties the business may struggle to recover these amounts. An entity can convert its accounts receivable balance to cash by selling its debtor's balance to a credit collection agency. This is however done at a discount so the entity will not receive the full value of the debtors book from the credit collection agency. This is known as the factoring of debtors.
- Inventory includes any goods or services that the company can sell to consumers. Companies often need, at the very least, a few months to convert their inventory to cash depending on the market and the skills of their sales team. If a company wanted to sell their inventory and liquidate their assets more quickly, it could consider using discounts and promotions, however, that might cause a smaller generation of cash.
- Fixed assets are items that a company or organization use to create their goods and services, including furniture, vehicles, land, buildings and more. These assets can take anywhere from a few days to a few months to sell depending on their current market potential. These assets are also very important to a business's overall production therefore, companies often wait to sell these items unless there is an emergency need for cash. When listing fixed assets, companies will put their original price minus any depreciation that's occurred. This helps to show how much each item will sell realistically.
How to assess the solvency and liquidity of the position of a business
The solvency and liquidity position of a business is typically calculated using financial ratios based on the financial statements of the entity. The balance sheet of the entity is the primary source of information to assess the financial health of an entity.
Liquidity Ratios
The key take away when assessing the liquidity of a business is that current assets should exceed the current liabilities. The more liquid the currents assets are the better. Liquid assets like cash should carrying a greater weighting then less liquid assets like inventory.
Current Ratio (Current Assets / Current Liabilities)
The current ratio measures a company's ability to pay off its current liabilities (payable within one year) with its current assets such as cash, accounts receivable, and inventories. The higher the ratio, the better the company's liquidity position. Typically, a current ratio above 1.5 is considered to be healthy. Anything below 1 could indicate that the entity may experience difficulty paying off its debts in the next 12 months.
When assessing the financial health of a business I also like to look at cash to the current liabilities. If the cash an entity currently has on the balance sheet exceeds the current liabilities this is a good sign of a business in a healthy financial position. This means that the business has cash readily available to settle its short-term obligations.
Solvency Ratios
The key takeaway when assessing the solvency of a business as that assets should exceed debt. The less debt a business has the less risky the business is. If an entity has enough cash on hand to pay-off most or all of its debt this is bonus.
Debt to Equity Ratio (Total Debt / Shareholders Equity)
Often abbreviated as D/E, the debt-to-equity ratio establishes a companys total debts relative to its equity. The ratio is calculated by dividing the total liability balance on the balance sheet by shareholders' equity. Generally, a good debt-to-equity ratio is anything lower than 1.0. A ratio of 2.0 or higher is usually considered risky. If a debt-to-equity ratio is negative, it means that the company has more liabilities than assetsthis company would be considered extremely risky. A negative ratio is generally an indicator of bankruptcy.
Interest coverage ratio (EBIT / Interest Expense)
The interest coverage ratio indicates how many times a company can use its earnings to pay off its interest expense. The interest coverage ratio is calculated by dividing a companys earnings before interest and taxes (EBIT) by its interest expense. The higher the interest coverage ratio the better, and the less likely the company is to default on any of its interest payments.
Debt to asset (Total debt / total assets)
The Debt to Asset Ratio, also known as the debt ratio, is a leverage ratio that indicates the percentage of assets that are being financed with debt. The higher the ratio, the greater the degree of leverage and financial risk. The debt to asset ratio is commonly used by analysts, investors, and creditors to determine the overall risk of a company. Companies with a higher ratio are more leveraged and, hence, riskier to invest in and provide loans to.
Practical Example: Thungela
Lets now bring all the theory we have learnt together and analyse the financial health of a company. For this example, I have used the 2021 financial statements of coal mining company Thungela (JSE: TGA).
The financial statements can be downloaded using the link below: https://thungela.s3.eu-west-1.amazonaws.com/downloads/investors/Thungela%20Summarised%20AFS%20.pdf
Liquidity Ratios:
Figures in Rand millions
Current Ratio
= Current Assets / Current Liabilities
= 16,374 / 4,261
= 3.84
Thungela has a current ratio of 3.84 meaning that the current exceeds are almost 4 times larger than the current liabilities. This is an indicator of a company in a strong financial position. Current assets are utilised to meet short term obligations. Thungela should be able to easily meet its short-term obligations given that current assets significantly exceed current liabilities.
Cash Ratio
= Cash and cash equivalents / Current Liabilities
= 8,736 / 4,261
= 2.05
Thungela has sufficient cash on hand to meet its short-term obligations. Thungela has a strong cash balance that can be used to pay off almost 70% of the entitys total debt should they wish to do so.
Solvency Ratios:
Debt to Equity Ratio
= Total Liabilities / Shareholders Equity
= 12,811 / 16,573
= 0.77
Thungela has a debt-to-equity ratio of less than 1 meaning that the entity is mainly funded through equity rather than through debt.
Interest Coverage Ratio
= EBIT / Interest Expense
= 7,509 / 680
= 11.04
The entity has a healthy interest coverage ratio and can use its earnings to comfortably meet its interest obligations.
Debt to assets ratio
= Total liabilities / Total assets
= 12,811 / 31,285
= 0.41
Roughly 40% of Thungelas assets are funded through debt. Typically, a debt to asset ratio of less than 40% is considered good or low risk while 60% or above is considered high risk or bad. Thungela thus has a good debt to asset ratio and is in a solvent position.
Related Tags:
Related Articles
All articles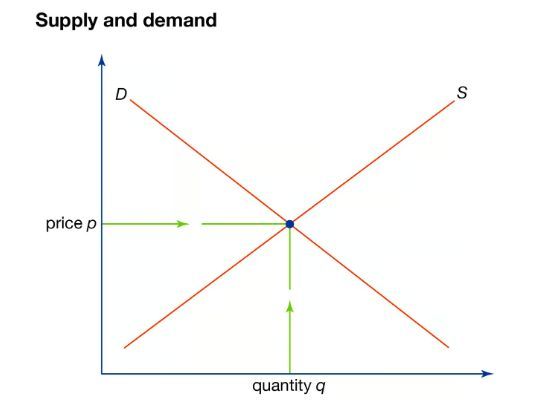
July 26, 2024, 7:27 p.m.
Why do prices go up and down?

July 26, 2024, 12:05 p.m.
UNDERSTANDING INVESTMENT HOLDING COMPANIES
July 26, 2024, 12:05 p.m.
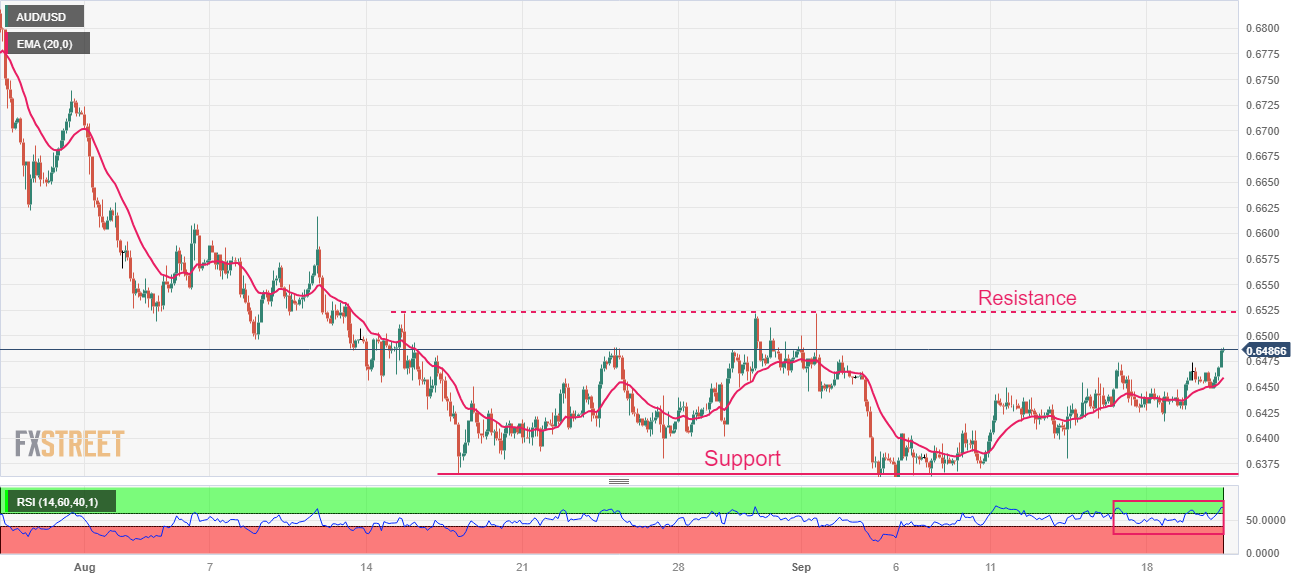
AUD/USD Market Outlook

July 26, 2024, 8:53 p.m.