
July 26, 2024, 8:53 p.m.
Bitcoin Technical Analysis
July 17, 2023
2
71
0

Author
Josh ViljoenBrief overview of the current bitcoin price and what to expect in the coming months
Bitcoin price has been in an overall downtrend since reaching new all time highs in November 2021.
The price is currently forming a bearish flag meaning that is likely that the price will break below the black trend line before continuing lower.
The bearish flag is a candlestick chart pattern that signals the extension of the downtrend once the temporary pause is finished. As a continuation pattern, the bear flag helps sellers to push the price action further lower.
After a strong downtrend, the price action consolidates within the two parallel trend lines in the opposite direction of the downtrend. Once the supporting trend line gets broken, the bear flag pattern is activated as the price action continues trading lower.
There is a strong level of support at $30 000 and should the bearish flag pattern play out I would expect this level of support to retested. This level of support has been retested multiple times in January and between May and July in 2021. The price has not closed below this level since 2020.
Conclusion
Overall the momentum is still downwards. If I was looking to add to my Bitcoin holdings I would be starting $30 000 as buying zone.
Related Tags:
Related Articles
All articles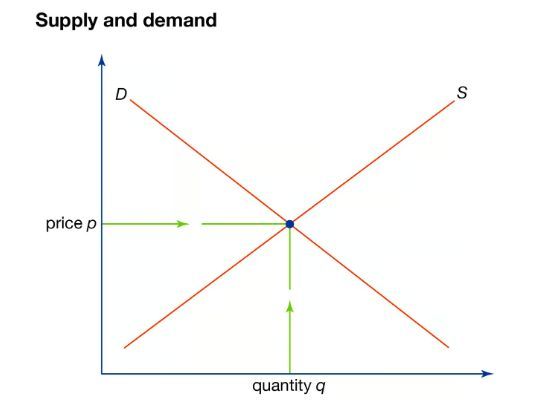
July 26, 2024, 7:27 p.m.
Why do prices go up and down?

July 26, 2024, 12:05 p.m.
UNDERSTANDING INVESTMENT HOLDING COMPANIES
July 26, 2024, 12:05 p.m.
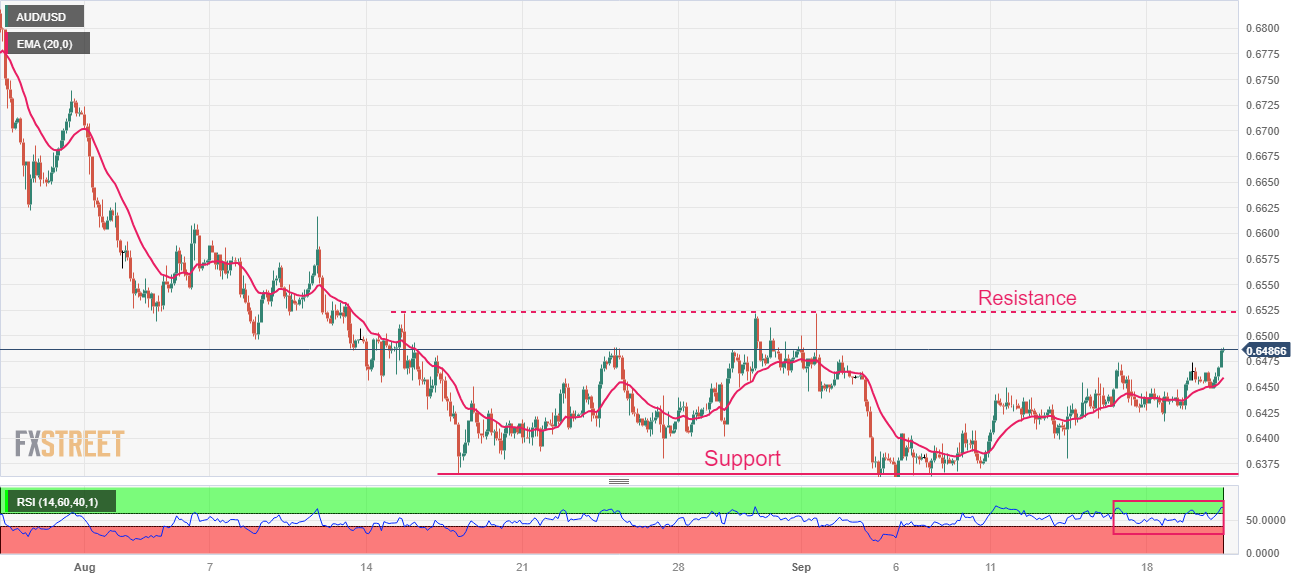
AUD/USD Market Outlook

July 26, 2024, 8:53 p.m.