
July 27, 2024, 3:04 a.m.
Bitcoin Technical Analysis
July 17, 2023
13
54
0

Author
Josh ViljoenA look at the price of bitcoin over the past year
Bitcoin is the worlds most traded cryptocurrency, representing a huge slice of the crypto market pie. It was the first digital coin and, as such, remains the most famous and widely adopted cryptocurrency in the world. The cryptocurrency has been extremely volatile since its inception with large price swings taking place in a matter of weeks and months.
In 2022 the cryptocurrency market has been hit heavily with many investors selling out cryptocurrency assets in favour of more stable asset classes due to fears of an upcoming recession. So much for crypto being a hedge against inflation. Year to date bitcoin has lost almost 60% of its value and is currently trading at under $20k a coin after starting the year at over $46k a coin.
When taking a look at the price chart we can see that Bitcoin has been in a downtrend since reaching highs in November 2021. The price chart has formed multiple bearish flag patterns in the past year with further downward price pressure resulting after each period of consolidation.
In recent months bitcoin has been trading sideways and consolidating with no significant volume to move the price up or down. The price has been hovering between $19k and $22k with $19k currently acting as a key level of support. Should the Bitcoin price close below $19k it could be set to move lower following the current downwards momentum it has seen over the past year.
If you are a long-term believer in Bitcoin then I dont see any problem with continuing to dollar cost average and accumulate bitcoin at the current price. If you are however looking to trade bitcoin, I would not be taking any long positions at the current price levels. A potential short trade could however be on the cards if bitcoin breaks below $19k and then retests this level.
Related Tags:
Related Articles
All articles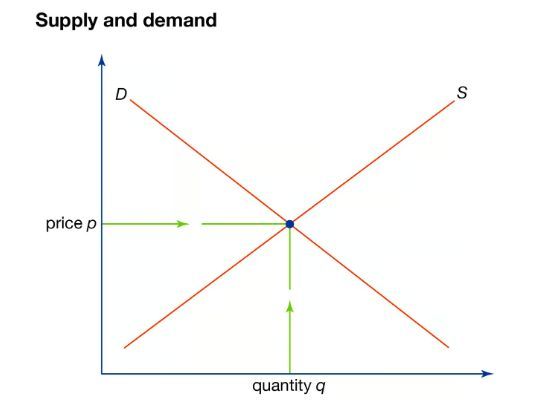
July 27, 2024, 6:24 a.m.
Why do prices go up and down?

July 27, 2024, 5:36 a.m.
UNDERSTANDING INVESTMENT HOLDING COMPANIES
July 26, 2024, 12:05 p.m.
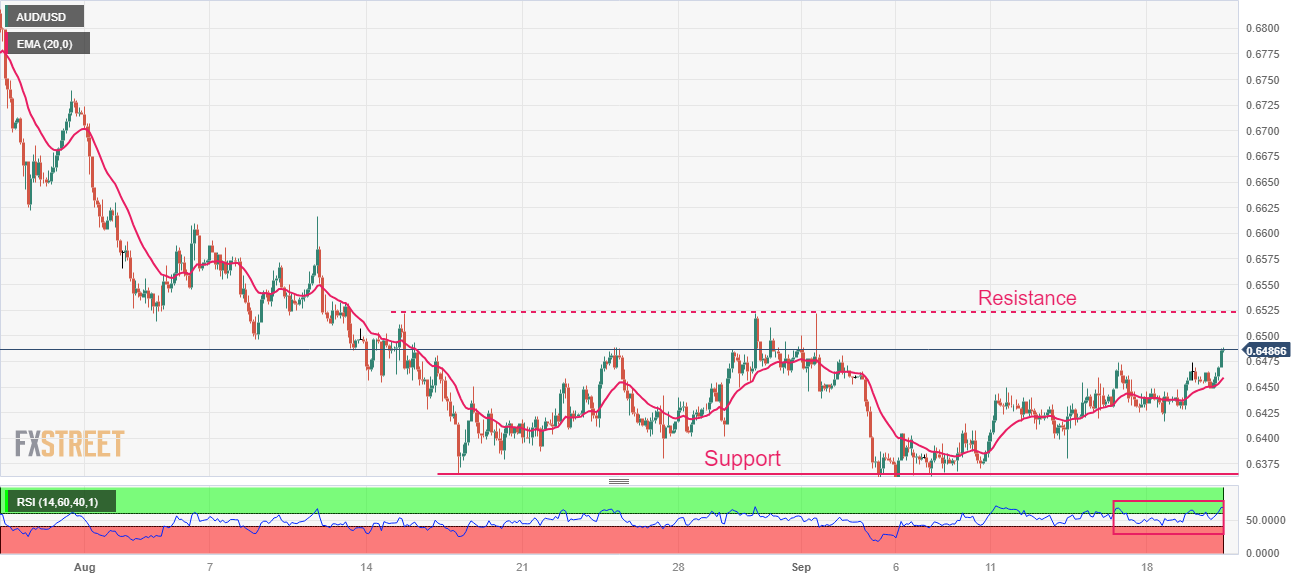
AUD/USD Market Outlook

July 26, 2024, 8:53 p.m.